
Mapping perspectives and actors
A way of understanding complex problems
Making perspective and actor maps is helpful for those designing and preparing for mediation, more extensive dialogue and collaboration processes and even meetings where there is the possibility of tension or conflict.
Maps can be drawn by hand on paper or on a whiteboard. You can use sticky notes and pens. They can also be made by using programs such as Kumu or even presentation software like Powerpoint and Keynote.
We differentiate between better-known actor maps and perspective maps. In some cases, these can be combined.
Actor maps
Identifying actors and creating a map that contains information about their importance in a process and their relationships with each other can be helpful in deciding which conversations may be needed in a mediation or dialogue process.
Here are two examples of such maps. The one on the left is a simple map that can be made in a matter of minutes, while the one on the right contains more information.
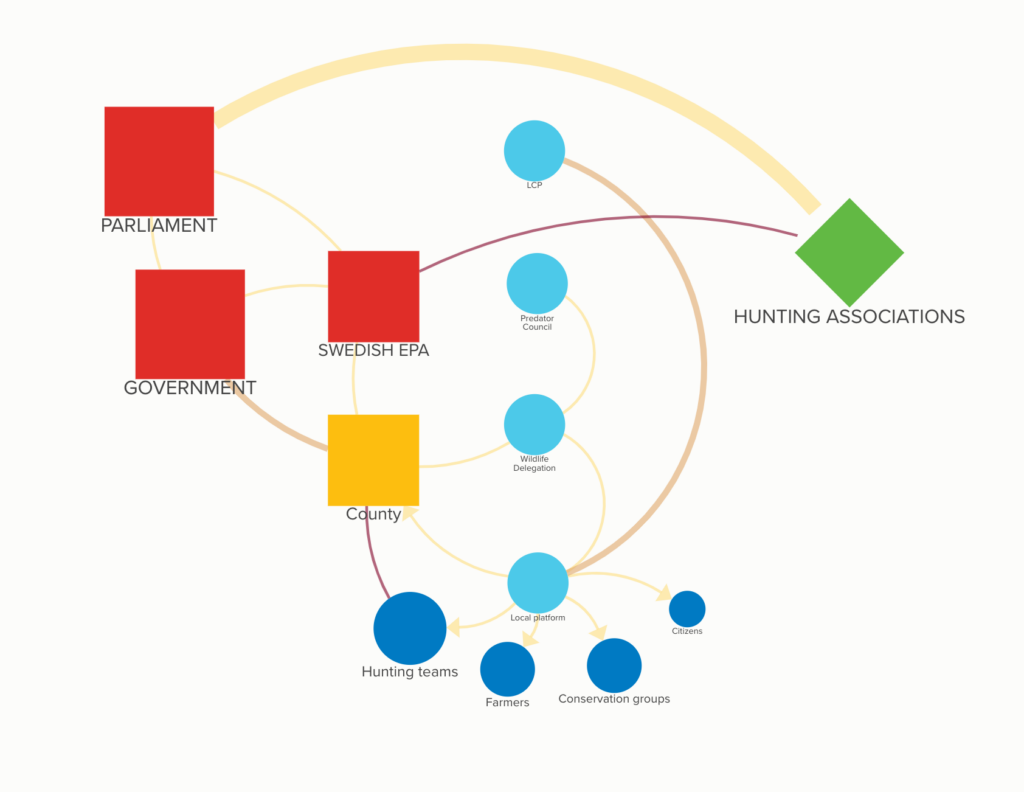
This map illustrates the actors involved in local, regional and national platforms for the management of large carnivores in Sweden. The map indicates the actors and the quality of communication between them. The size of the icons indicates the power that each of the actors has in relation to any decisions that are made.
It is a simple map. This map was made on Kumu but could just as easily have been hand drawn or made on presentation software such as Powerpoint or Keynote.
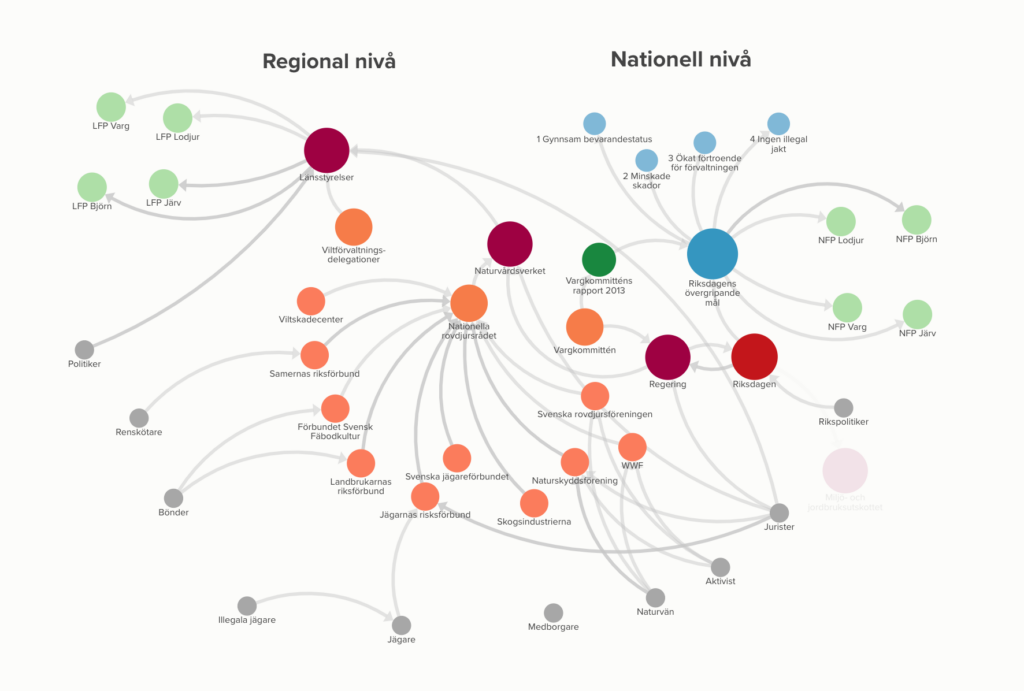
This is a more extensive initial map of actors involved in large carnivore conflicts in Sweden. The tags are in Swedish, but it gives you an idea of what a more elaborate map, involving more actors, would look like. The map was made on Kumu, a program that allows you to enter easily accessible information about each of the actors.
Perspective maps
Complex societal conflicts or issues are characterised by the fact that those involved hold different perspectives. They may disagree on the nature of the problem and on potential ways of resolving or managing it. We have seen that stakeholder organisations sometimes represent people with different perspectives and that certain perspectives are shared by several stakeholder groups.
The conflict surrounding wolves illustrates this well. There are those who are opposed to the preservation of wolves and those who wish to preserve them. Within the a citizen organisation, for example, there will be those who favour conservation and those who feel that wolves present a problem. Both these perspectives need to be made visible.
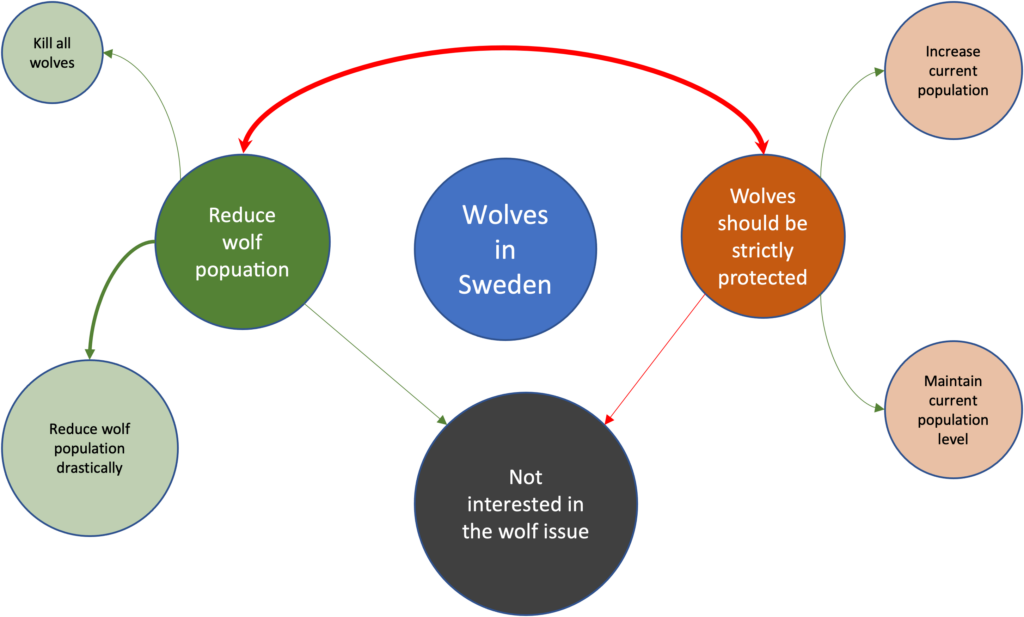
This map was made on Powerpoint and is a simplification of the two main perspectives on the wolf issue in Sweden. There are, of course, other perspectives that are related to these main positions on wolves. The moment you ask questions regarding reasons for the opposition to wolves, the map becomes more complicated. When you begin to consider subsidiary issues such as the protection of livestock and hunting, the map becomes larger.
We do not suggest that such a map is sufficient in order to gain an understanding of the complexity of an issue. It merely illustrates that maps differ in their content depending on how many perspectives you choose to incorporate.
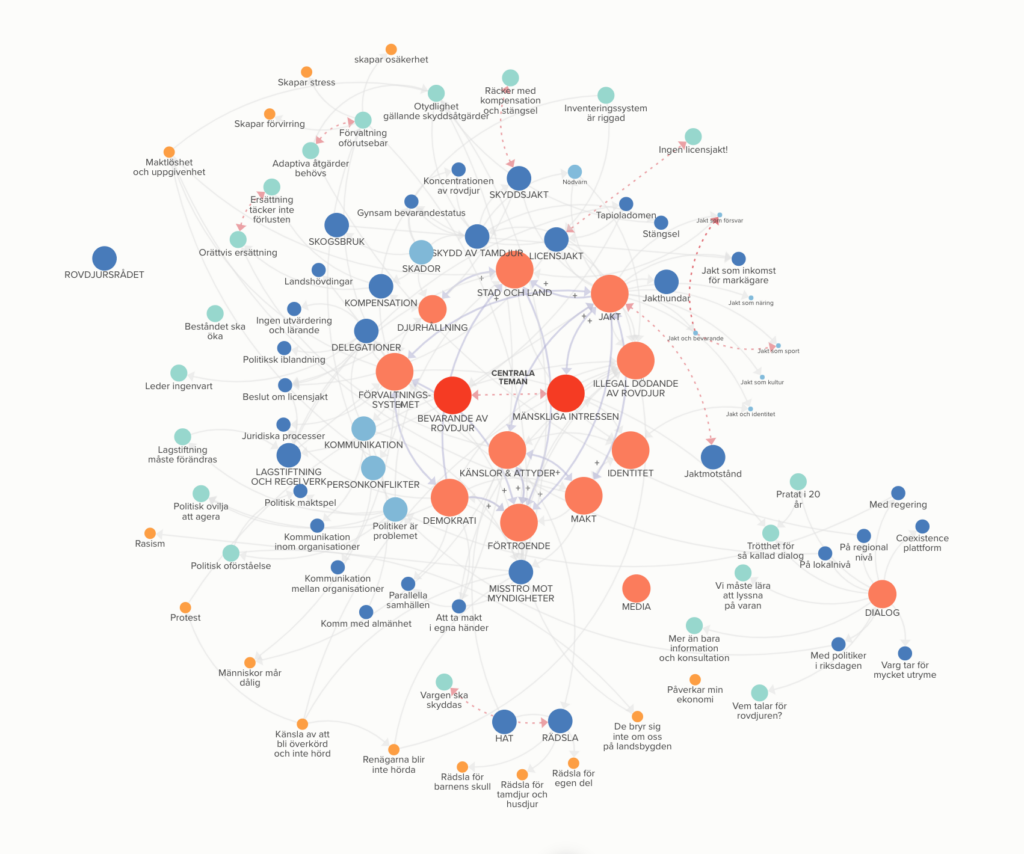
This rather dense map illustrates the perspectives that became visible during an extensive perspective inventory conducted at the start of a project aiming at exploring the potential of dialogue in reducing the conflicts surrounding large carnivores in Sweden.
The faint lines indicate relationships between issues. It soon becomes clear that most issues are in some way interrelated. This is of course one of the key characteristics of a complex conflict (or wicked problem as it is sometimes referred to).